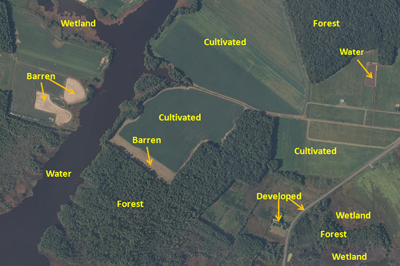
Figure 1. Image of Black Water National Wildlife Refuge for classification with example land cover categories (provided by NCSU GIS 520).
|
ProblemHow can we use remotely sensed images to make sense of features on the ground? In this example, we helped land managers at the Black Water National Wildlife Refuge classify an existing parcel of land in order to make future land management decisions. In this case, we categorized features as Water, Cultivated, Developed, Forest, Barren, or Wetland.
|
Analysis Procedures |
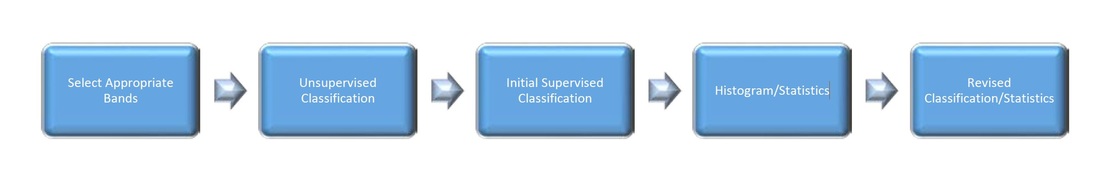
First, we selected the appropriate image band for our classification. In this case, using a false color composite image based on Normalized Differential Vegetation Index (NDVI) to help us see healthy vegetation (cultivated areas, forest) and differentiate them from wetlands. Second we conducted an unsupervised classification of our data to determine where potential friction points exist between our classes. This allowed us to select training sites in an informed manner that results in a more accurate classification. We then selected training sites for each class and run an initial supervised classification. Next we examined the histogram of our initial supervised classification to see that the classes diverge and have sufficient spectral separation. Finally, we conducted a second classification to yield more accurate results. This time we selected more training sites, especially for those classes that had significant overlap. Based on the results, we calculated an estimated area and percentage of each land category.
|
Results
The initial classification misclassified significant amounts of cultivated area for forest. It also had issues effectively distinguishing wetlands from shadowed areas. Water and Wetlands were also frequently misclassified (Figures 2 and 3). We added additional training sites for areas that were often confused, which resulted in a more accurate result. Portions of forested areas were misclassified as cultivated and shadows were misclassified as wetlands, but the result is much improved (Figures 4 and 5). Results could be improved further by comparing another round of classification on a true color image.
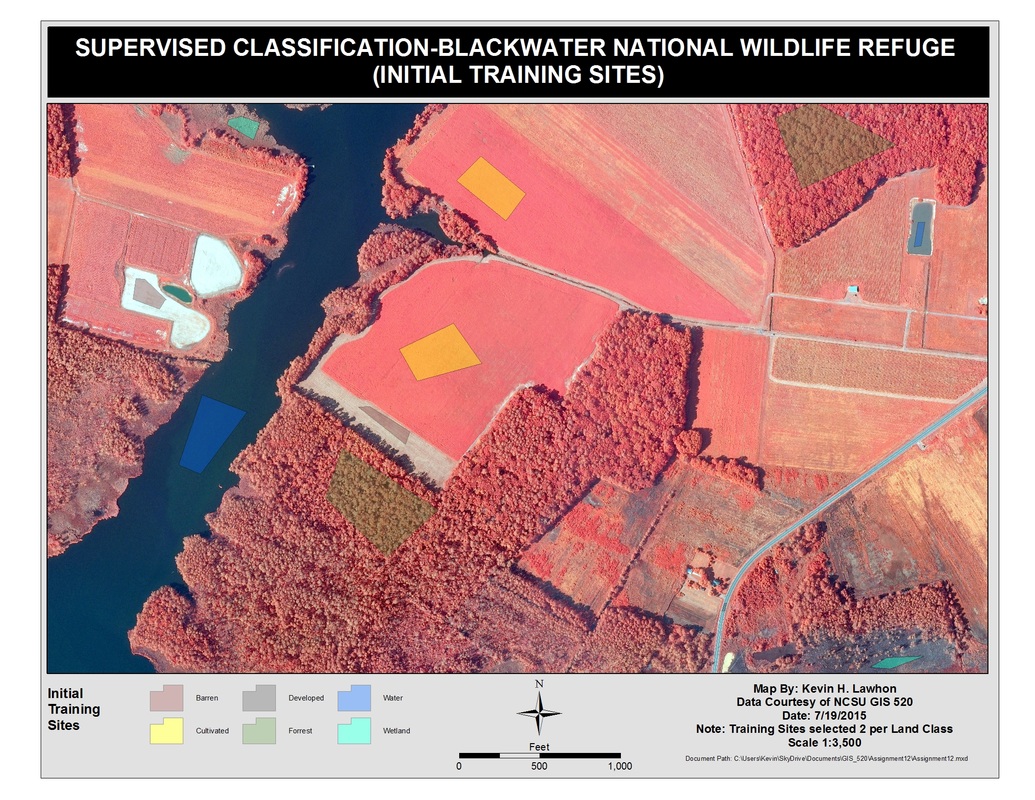
Figure 2. Initial Training Sites
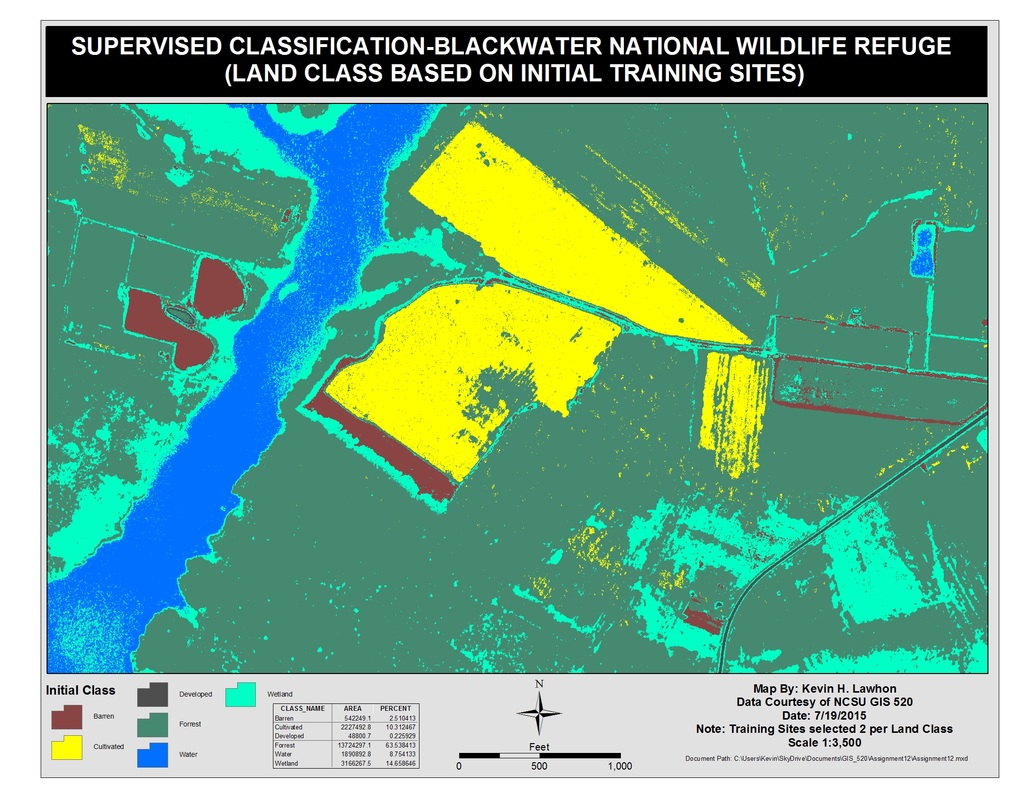
Figure 3. Classification based on Initial Training Sites
|
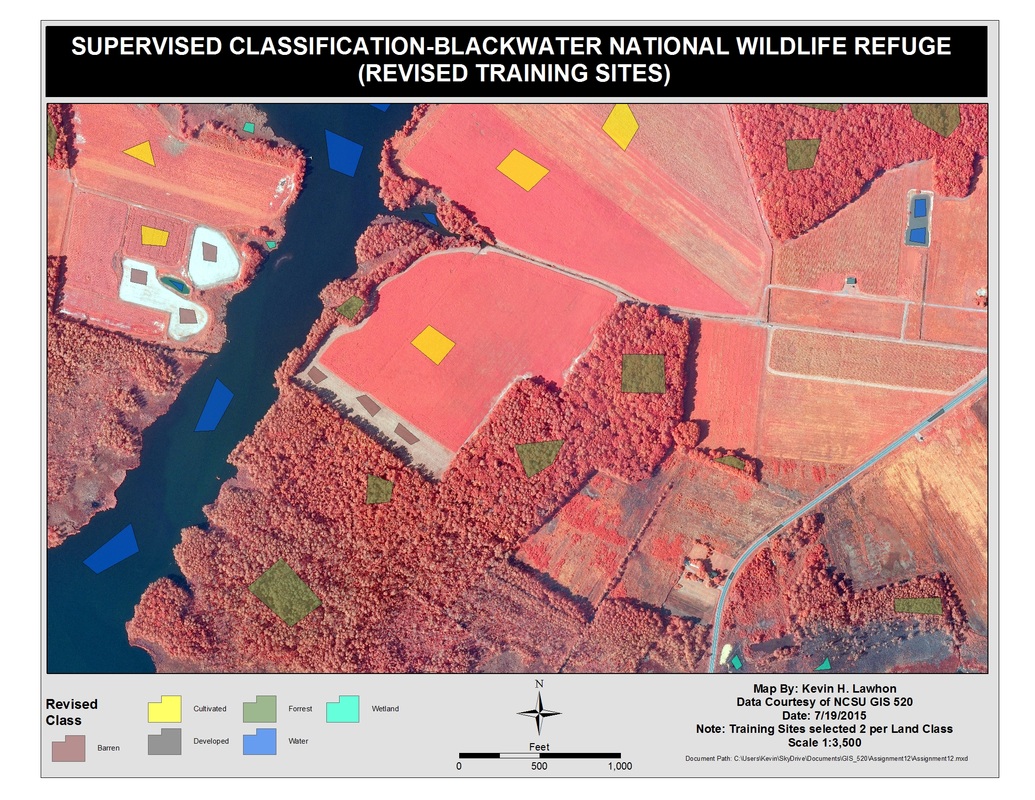
Figure 4. Revised Training Sites
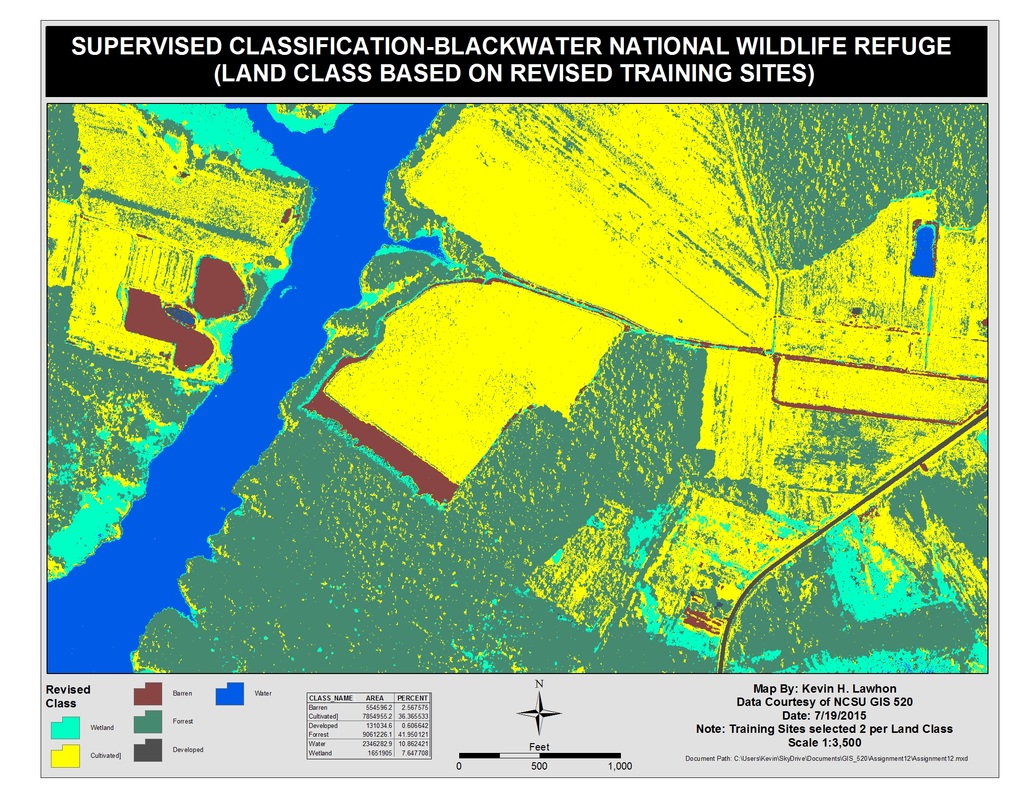
Figure 5. Classification based on Revised Training Sites
|
|
This skills learned in this module can be used to solve any number of different land management problems. For example, Figure 6. shows a supervised classification that was used to estimate fire damage in Silverado Canyon, CA last year. The fire occurred near abandoned silver mines tailings ponds, which contain potentially toxic material. A supervised classification of LANDSAT images from before and after the fire helped ascertain how much vegetation was consumed in the blaze. The fire perimeter was then compared with a soils map and hydrology vector data to determine areas where tailings pond run off might be most likely.
|
Application and Reflection

Figure 6. Before and After classifications of a fire perimeter in Silverado Canyon, CA. This classification was done as a part of GIS 512: Remote Sensing
|
